
Note
Go to the end to download the full example code
1.5.12.9. Spectrogram, power spectral density
Demo spectrogram and power spectral density on a frequency chirp.
import numpy as np
import matplotlib.pyplot as plt
Generate a chirp signal
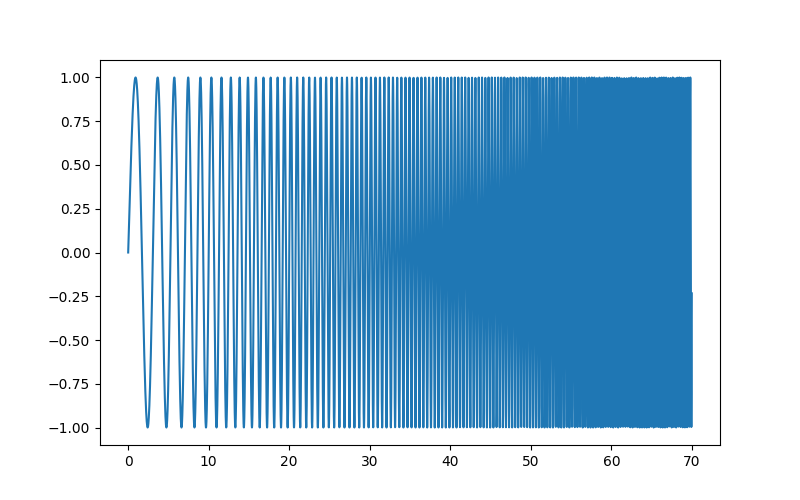
[<matplotlib.lines.Line2D object at 0x7fe7b04e1310>]
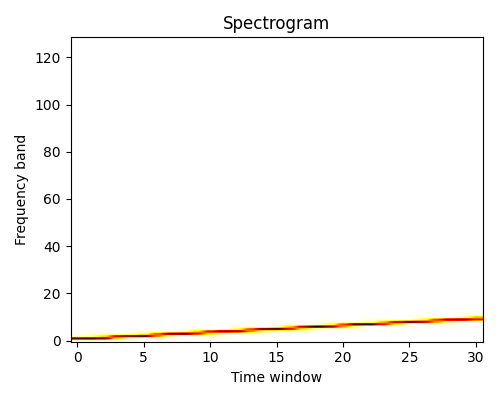
Compute and plot the spectrogram
The spectrum of the signal on consecutive time windows
import scipy as sp
freqs, times, spectrogram = sp.signal.spectrogram(sig)

plt.figure(figsize=(5, 4))
plt.imshow(spectrogram, aspect='auto', cmap='hot_r', origin='lower')
plt.title('Spectrogram')
plt.ylabel('Frequency band')
plt.xlabel('Time window')
plt.tight_layout()
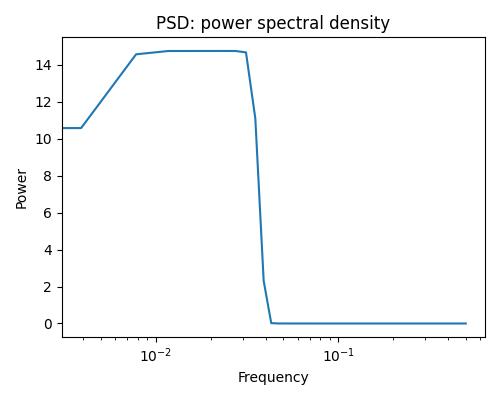
Compute and plot the power spectral density (PSD)
The power of the signal per frequency band
freqs, psd = sp.signal.welch(sig)

plt.figure(figsize=(5, 4))
plt.semilogx(freqs, psd)
plt.title('PSD: power spectral density')
plt.xlabel('Frequency')
plt.ylabel('Power')
plt.tight_layout()
plt.show()
Total running time of the script: ( 0 minutes 0.273 seconds)