
Note
Go to the end to download the full example code
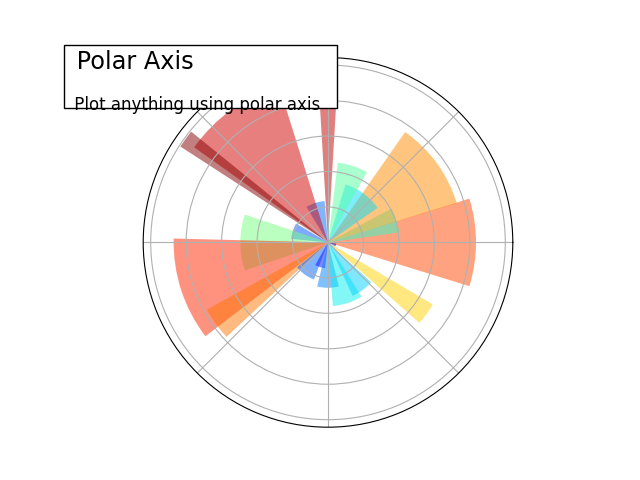
Plotting in polar, decorated
An example showing how to plot in polar coordinnate, and some decorations.
import numpy as np
import matplotlib.pyplot as plt

plt.subplot(1, 1, 1, polar=True)

N = 20
theta = np.arange(0.0, 2 * np.pi, 2 * np.pi / N)
radii = 10 * np.random.rand(N)
width = np.pi / 4 * np.random.rand(N)
bars = plt.bar(theta, radii, width=width, bottom=0.0)
for r, bar in zip(radii, bars):
    bar.set_facecolor(plt.cm.jet(r / 10.))
    bar.set_alpha(0.5)
plt.gca().set_xticklabels([])
plt.gca().set_yticklabels([])


plt.text(-0.2, 1.02, " Polar Axis                  \n",
      horizontalalignment='left',
      verticalalignment='top',
      size='xx-large',
      bbox=dict(facecolor='white', alpha=1.0),
      transform=plt.gca().transAxes)

plt.text(-0.2, 1.01, "\n\n Plot anything using polar axis ",
      horizontalalignment='left',
      verticalalignment='top',
      size='large',
      transform=plt.gca().transAxes)

plt.show()
Total running time of the script: ( 0 minutes 0.088 seconds)